Lending Markets
Lending Markets is a discovery and analytics page for every Compound-protocol-style lending market vfat.io indexes, across all supported chains: thousands of markets in one table.
KPIs
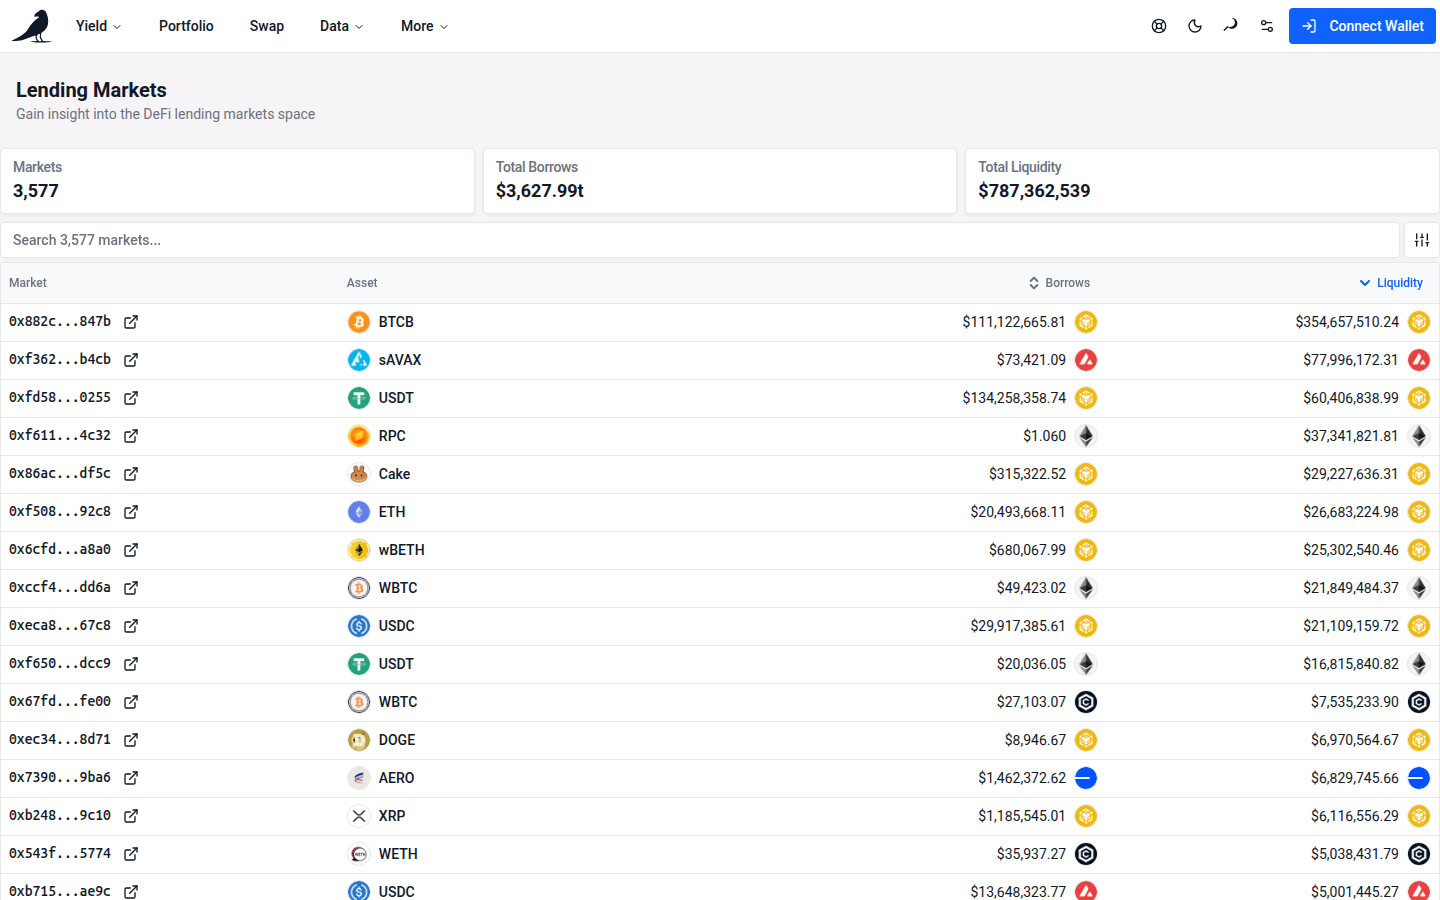
Three headline numbers sit above the table, aggregated server-side across every market matching your current search/chain filters, not just the rows currently loaded on screen:
- Markets: how many lending markets match. Without a search, the line under it shows how many chains they span and how many markets couldn’t be loaded because their token details are missing.
- Liquidity: combined cash available to borrow, in your display currency
- Borrowed: combined outstanding borrows, in your display currency
vfat.io cleans the market data before adding it up. Some markets keep their own books in 18 decimals on 6- or 8-decimal tokens; their borrows are converted to the token’s units, so a market that once read $3 quadrillion borrowed shows about $3,000. An amount larger than the token’s whole supply can’t be right: its row shows — for that amount and its utilization, and the totals leave it out. A market whose cash is under 0.1% of its borrows is marked Drained: exploited or abandoned markets keep their debt on-chain with nothing left to lend, so Borrowed leaves that debt out. The line under each total says how many markets it leaves out, such as “excludes 31 drained and 12 impossible markets”.
Table
Each row is one market, showing:
- Asset: the underlying token that market lends and borrows, with its chain on the logo
- Market: the market’s name, such as Venus BTC, which usually names its protocol, with a Drained badge when no liquidity is left
- Chain: the network the market runs on
- Liquidity: cash left to borrow
- Borrowed: total borrowed from that market
- Utilization: the share of the market’s supplied funds that is lent out, as Compound computes it: borrowed ÷ (liquidity + borrowed − reserves). The bar shows the same share. It reads at most 100%: a drained market whose reserves exceed its cash computes above that.
- The arrow at the end opens the market’s contract on scan.vf.at.
On phones, rows show the asset, liquidity and utilization; tap a row to see its market (with its Drained badge), chain, borrowed amount and explorer link. Amounts are shortened there, such as $348.8m.
Use the sort button beside search on phones to choose Liquidity or Borrowed and high-to-low or low-to-high order. Desktop USD and EUR amounts use whole units above one currency unit; smaller values and other display currencies retain their usual precision. Hover or tap an amount to see its full value.
Click Liquidity or Borrowed to sort by that column (defaults to Liquidity, descending). Sorting, search and chain filtering all happen server-side, so they apply across the full dataset rather than just what’s loaded. Markets whose amount is unknown sort after all others in either direction. Utilization isn’t sortable yet. The table starts with 50 markets and loads the next 50 as you scroll. Supply and borrow rates aren’t shown: the API doesn’t provide them yet.
Filtering
- Search matches market or underlying-token names, symbols, and addresses, ignoring case. It searches every matching market, not just what’s already loaded. Open Search help for examples.
- The Chain chip in the bar along the top of the table opens a chain picker: choose one or more chains to narrow the table, or All except to leave one out. The × beside the chip, or Reset beside the count, goes back to every chain.
- The bar also shows how many markets match out of all that match your search, such as 12 of 40 markets, and Sort to switch between Liquidity and Borrowed or change direction. On a phone, the count shortens and sort sits beside the search.
Scope
This page is informational: it’s a way to compare lending market depth and utilization across chains and protocols at a glance. There’s no in-app lend/borrow/repay flow here. Use it to find where liquidity and borrow demand are concentrated, then transact on the underlying protocol directly.